Indonesian agriculture data: is the incremental real?
Indonesian agriculture data: is the incremental real?
Recently, both the Indonesian Ministry of Agriculture and the Jakarta office of the US Department of Agriculture (USDA) reported on corn production and harvested area. While the numbers always show some differences due to the use of different methodologies, this time the gap widened significantly.
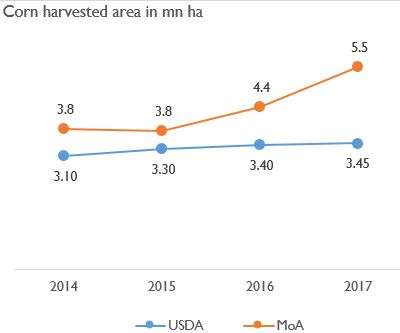
Corn harvested area 2014-2017: MoA vs. USDA data
Looking at the graph above, USDA data suggests a significantly lower growth of harvested area in the past four years. The gap with the Indonesian government’s data is big. In 2017, the Indoensian government reported 5.5mn ha corn harvested area, while the USDA reported 3.45mn ha. That is a gap of 2.05mn ha!
This highlights the difficulty of obtaining the right data in emerging markets, and leads us to wonder which data is more reliable in this case.
Since it would require a good amount of resources to verify the absolute levels agriculture output, we choose to focus on verifying the change in harvested area.
We believe that USDA data tend to understate the corn area expansion. Here is why.
Sanity check 1: rising farming inputs suggest higher output
Take a look at pesticide sales data, for example. We argued before that pesticides sales by commercial producers should be a fair proxy to indicate production trends in farming activities.
Unlike seed and fertiliser, pesticide is least prone to substitution effects. For example, commercial seed purchases can be substituted by seeds grown by farmers themselves, while commercial fertilisers can be substituted by organic waste.
For pesticides, however, there are hardly any substitutes. Homemade organic pesticides, for example, are barely scalable and too ineffective to save one’s farmland from becoming an all-you-can-eat buffet for insects and pests.
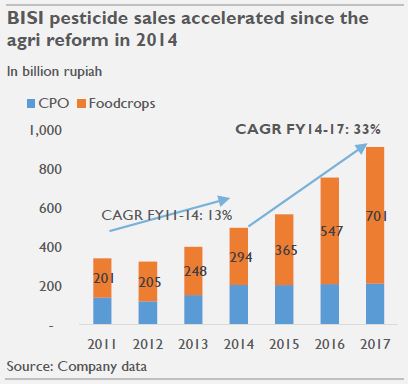
BISI reported +33% CAGR pesticide sales growth in the food crops area growth during the Jokowi agri reform (2014-2017) while its market share and average selling price did not change much. It is a significant acceleration from the 13% CAGR 2011-2014 before the reform kicked in.
Sanity check 2: forestry companies have added sizable intercropping area
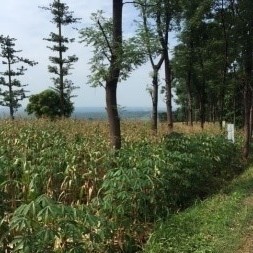
Another set of data also indicates that USDA data is too conservative. If we look at data from SOE Forestry company Perhutani 2016 annual report, no less than 118k ha of their forestry area have been allocated for corn intercropping by the local farmers.
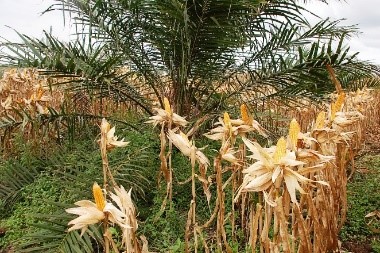
Separately, the SOE plantation company PTPN 2 has stated that approximately 73k ha of corn has been intercropped by local farmers in the PTPN’s palm oil areas. Young palm oil trees are not yet productive, thus planting corn as the intercrop makes sense.
The sum of 118k ha from Perhutani and 73k ha from PTPN 2 alone is 191k ha incremental corn harvested area. This is already bigger than the entire increase in corn harvested area from 2015 to 2017 based on USDA data!
Sanity check 3: conversion from other food crops
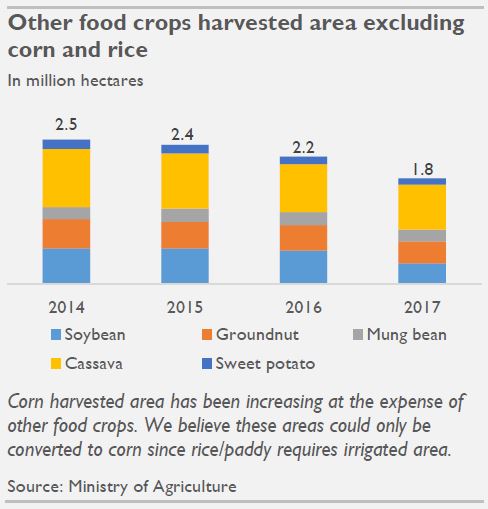
The increase in corn harvested area also could be explained by the shrinking harvested area of other food crops.
From 2014 to 2017, corn harvested areas have increased by 1.7mn ha. And the expansion is being compensated by other food crop areas shrinking by 0.7mn ha in the same period.
The explanation for the expansion in corn harvested area is mainly economics, as favourable domestic corn price has encouraged farmers to switch to corn farming.
Another reason is that some other crops have yields that are not competitive globally. For instance, Indonesian soybean production yield is only 1.5 ton/ha.
This is less than half of US yield of 3.4 ton/ha using GMO seed. In the end, soybean is more ideal for subtropical countries rather than tropical given that soybean is more drought sensitive relative to corn.
Incremental must be real
In summary, adding corn intercropping from young forest and CPO areas and conversion from other food crops already explains 0.9mn ha out of 1.7mn ha increase in corn harvested area.
The rest could easily be explained by recent village infrastructure build up. New dams, water basins, and better irrigation systems have increased the number of plantings per year.
To sum up, there is no way to know exactly which data is accurate. This gap of 2mn ha is so big that it needs closing. Simple approaches, however, suggest that the actual increase in harvested area should be closer to Indonesian government’s data.
Share
Recently, both the Indonesian Ministry of Agriculture and the Jakarta office of the US Department of Agriculture (USDA) reported on corn production and harvested area. While the numbers always show some differences due to the use of different methodologies, this time the gap widened significantly.
Corn harvested area 2014-2017: MoA vs. USDA data
Looking at the graph above, USDA data suggests a significantly lower growth of harvested area in the past four years. The gap with the Indonesian government’s data is big. In 2017, the Indoensian government reported 5.5mn ha corn harvested area, while the USDA reported 3.45mn ha. That is a gap of 2.05mn ha!
This highlights the difficulty of obtaining the right data in emerging markets, and leads us to wonder which data is more reliable in this case.
Since it would require a good amount of resources to verify the absolute levels agriculture output, we choose to focus on verifying the change in harvested area.
We believe that USDA data tend to understate the corn area expansion. Here is why.
Sanity check 1: rising farming inputs suggest higher output
Take a look at pesticide sales data, for example. We argued before that pesticides sales by commercial producers should be a fair proxy to indicate production trends in farming activities.
Unlike seed and fertiliser, pesticide is least prone to substitution effects. For example, commercial seed purchases can be substituted by seeds grown by farmers themselves, while commercial fertilisers can be substituted by organic waste.
For pesticides, however, there are hardly any substitutes. Homemade organic pesticides, for example, are barely scalable and too ineffective to save one’s farmland from becoming an all-you-can-eat buffet for insects and pests.
BISI reported +33% CAGR pesticide sales growth in the food crops area growth during the Jokowi agri reform (2014-2017) while its market share and average selling price did not change much. It is a significant acceleration from the 13% CAGR 2011-2014 before the reform kicked in.
Sanity check 2: forestry companies have added sizable intercropping area
Another set of data also indicates that USDA data is too conservative. If we look at data from SOE Forestry company Perhutani 2016 annual report, no less than 118k ha of their forestry area have been allocated for corn intercropping by the local farmers.
Separately, the SOE plantation company PTPN 2 has stated that approximately 73k ha of corn has been intercropped by local farmers in the PTPN’s palm oil areas. Young palm oil trees are not yet productive, thus planting corn as the intercrop makes sense.
The sum of 118k ha from Perhutani and 73k ha from PTPN 2 alone is 191k ha incremental corn harvested area. This is already bigger than the entire increase in corn harvested area from 2015 to 2017 based on USDA data!
Sanity check 3: conversion from other food crops
The increase in corn harvested area also could be explained by the shrinking harvested area of other food crops.
From 2014 to 2017, corn harvested areas have increased by 1.7mn ha. And the expansion is being compensated by other food crop areas shrinking by 0.7mn ha in the same period.
The explanation for the expansion in corn harvested area is mainly economics, as favourable domestic corn price has encouraged farmers to switch to corn farming.
Another reason is that some other crops have yields that are not competitive globally. For instance, Indonesian soybean production yield is only 1.5 ton/ha.
This is less than half of US yield of 3.4 ton/ha using GMO seed. In the end, soybean is more ideal for subtropical countries rather than tropical given that soybean is more drought sensitive relative to corn.
Incremental must be real
In summary, adding corn intercropping from young forest and CPO areas and conversion from other food crops already explains 0.9mn ha out of 1.7mn ha increase in corn harvested area.
The rest could easily be explained by recent village infrastructure build up. New dams, water basins, and better irrigation systems have increased the number of plantings per year.
To sum up, there is no way to know exactly which data is accurate. This gap of 2mn ha is so big that it needs closing. Simple approaches, however, suggest that the actual increase in harvested area should be closer to Indonesian government’s data.
Share