The 1974 Illusion: Why Wall Street is Dead Wrong About the Gold Sell-Off
The 1974 Illusion: Why Wall Street is Dead Wrong About the Gold Sell-Off
Let’s talk about the gold panic.
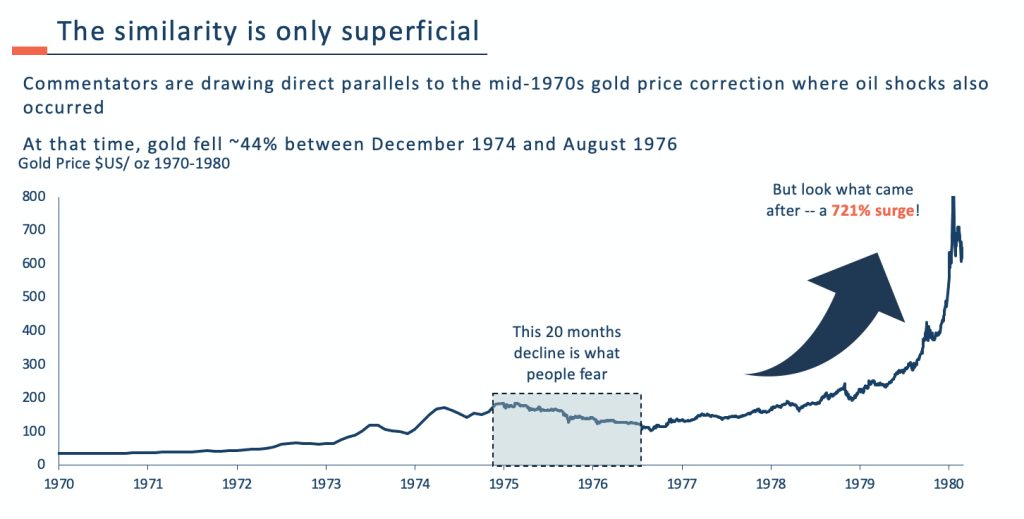
This past March, gold took a sharp around 15% dive in 4 weeks. Cue the mainstream commentators rushing to their history books, frantically pointing to the mid-1970s. They want you to look at the correction between December 1974 and August 1976, when gold plummeted 44% amid oil shocks and rate hikes.
The narrative they are peddling? An oil shock is happening right now too. The bull run is over. Pack it up.
It’s a great story. But it is built on a massive macro illusion. Comparing the monetary landscape of 1974 to the mathematical reality of 2026 is worse than comparing apples to oranges—it’s like comparing a paper cut to a terminal diagnosis.
If you are selling your physical assets here, you are falling for a massive liquidity trap. Let’s look at the math.
The Death of the Volcker Playbook
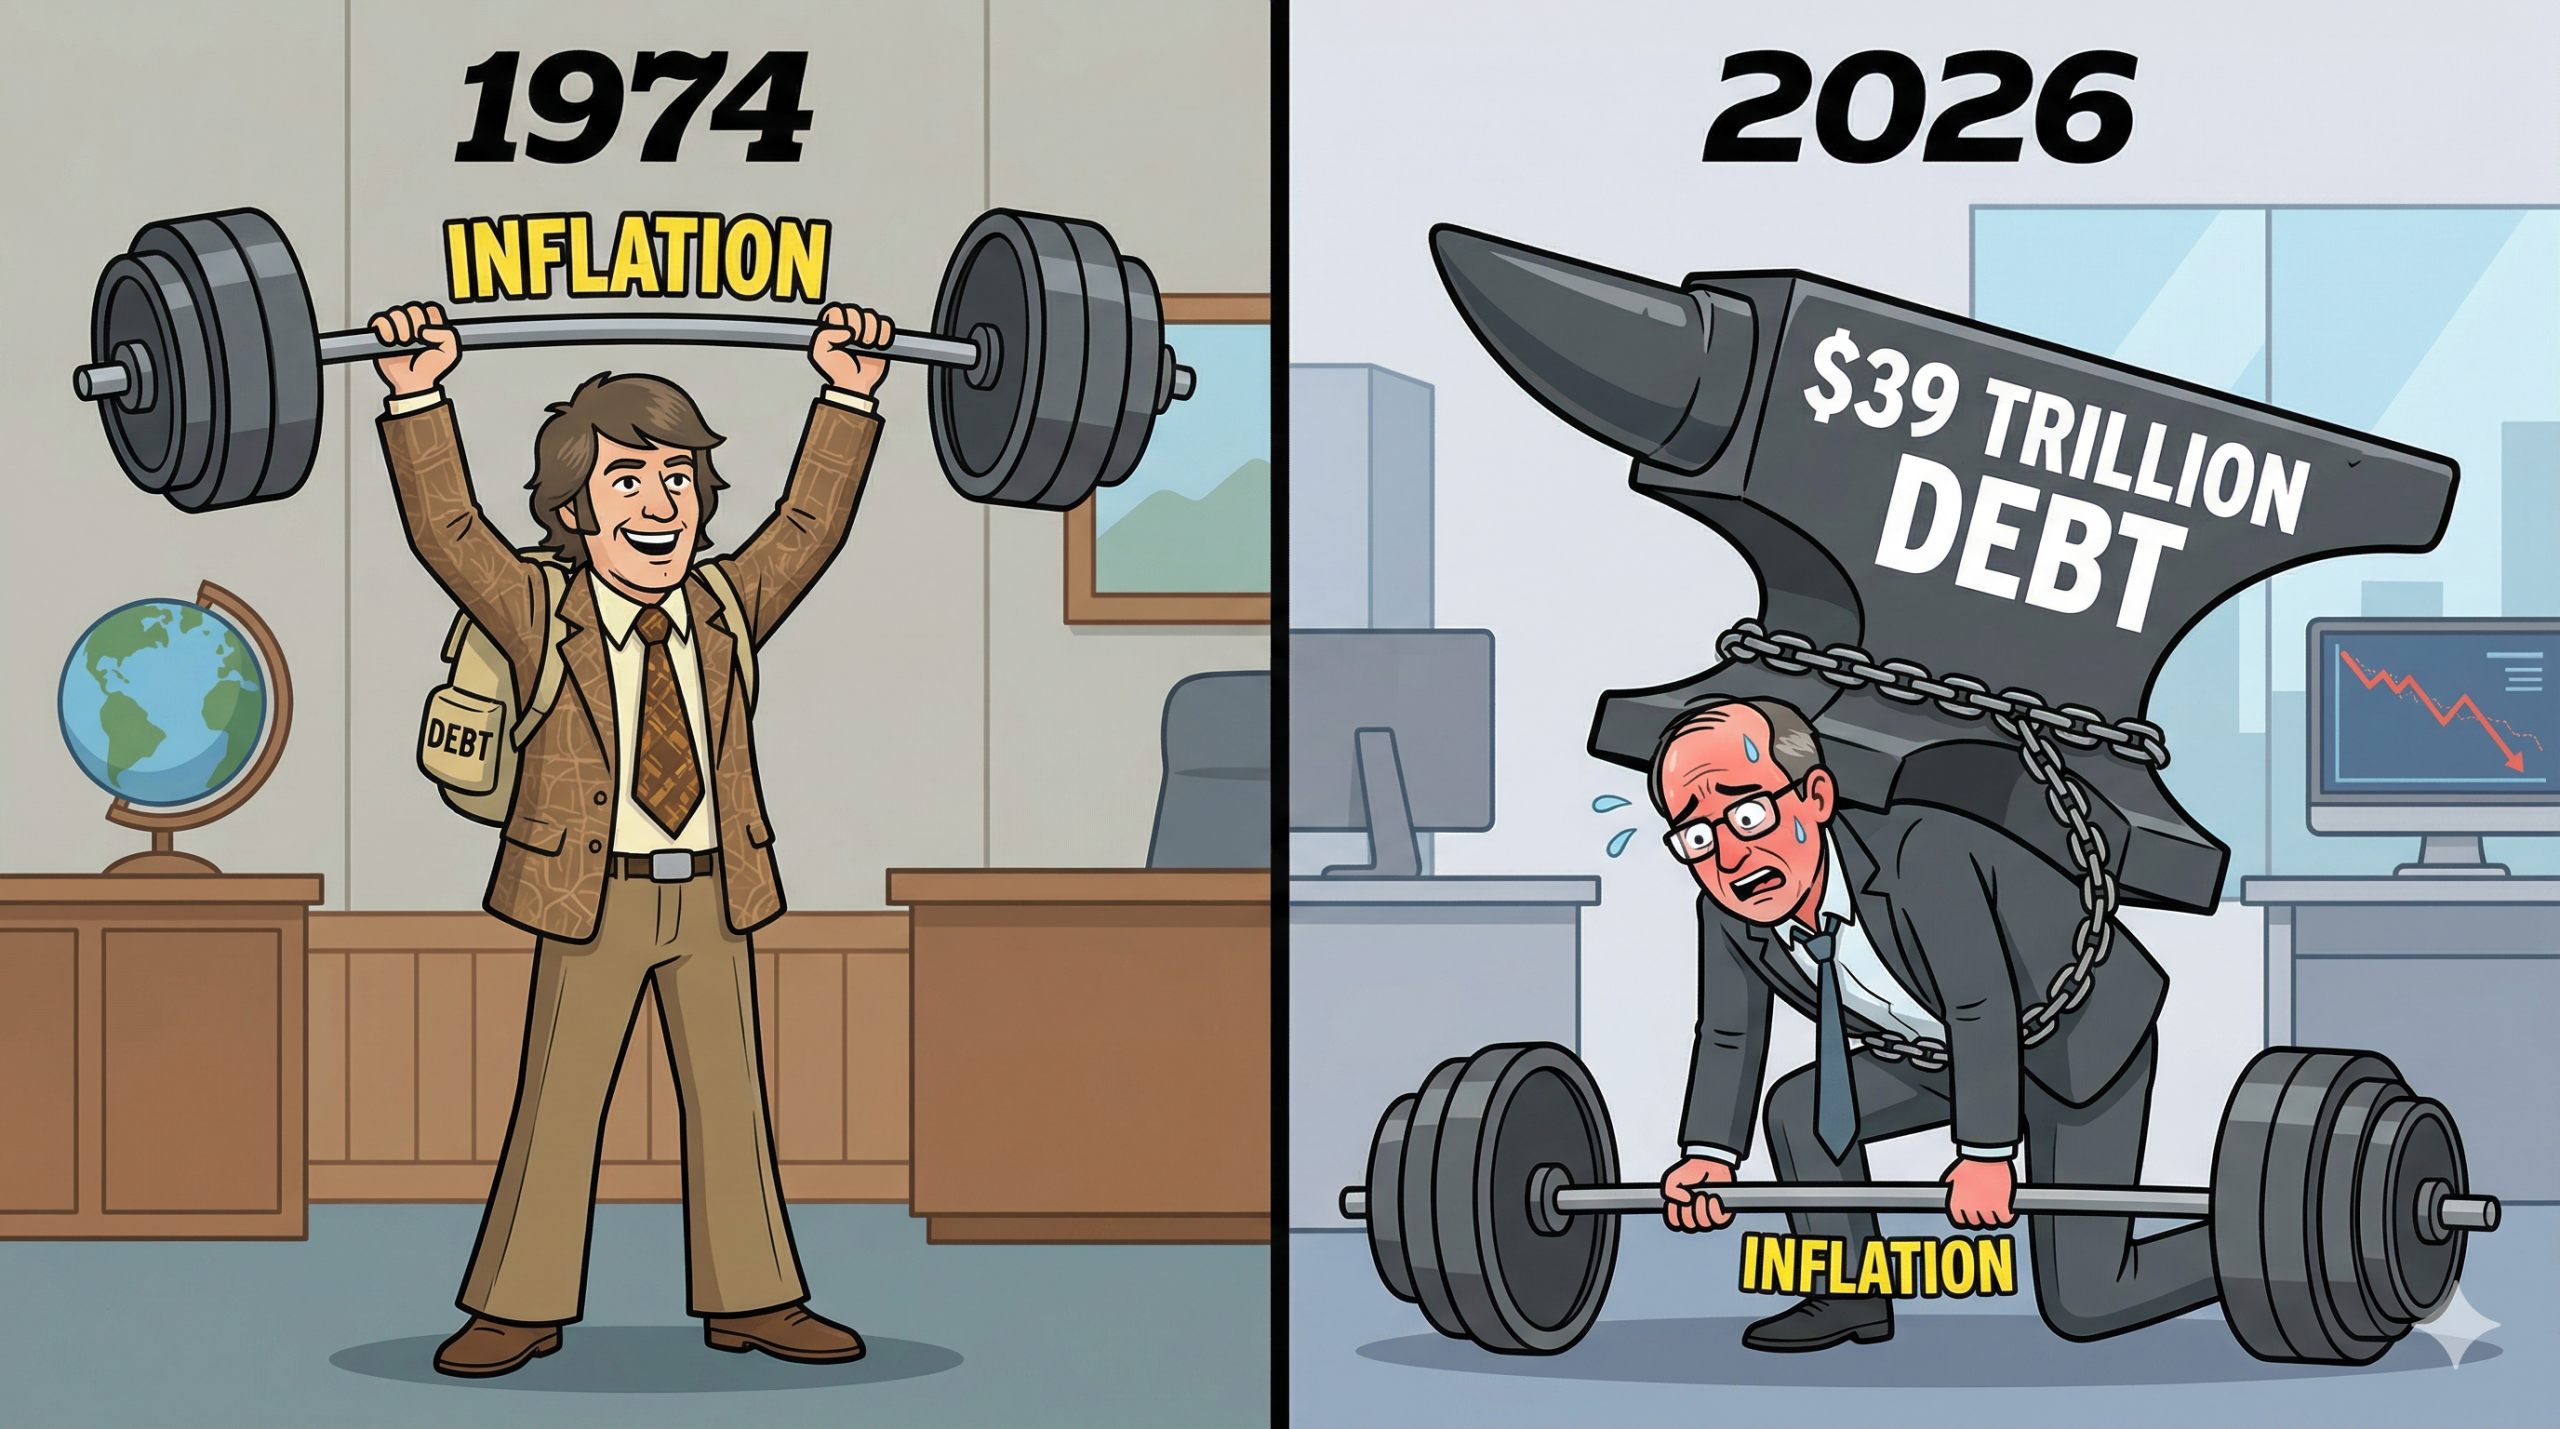
To understand why 1974 played out the way it did, you have to look at the sovereign balance sheet.
Back then, the U.S. debt-to-GDP ratio was sitting around 33%. The fiscal house was relatively clean. Because the government wasn’t drowning in leverage, Paul Volcker had the superpower of policy flexibility. He could hike the fed funds rate above 17% to crush inflation. It was brutal medicine, but the system could absorb it. Real rates spiked, inflation died, and gold naturally corrected.
Source: Heyokha Research
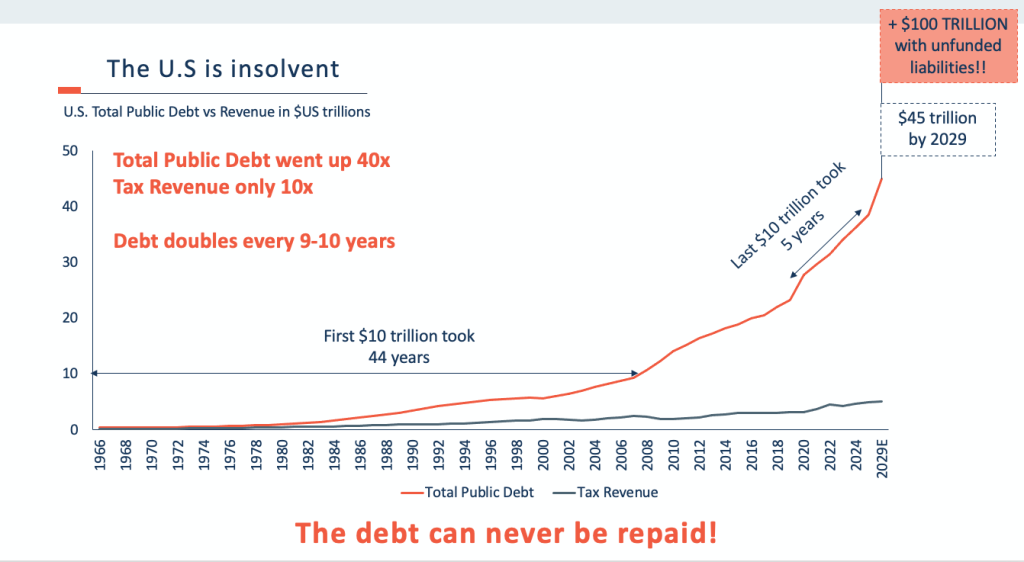
Welcome to 2026. Debt-to-GDP is 122%. The federal debt is a staggering $39 trillion.
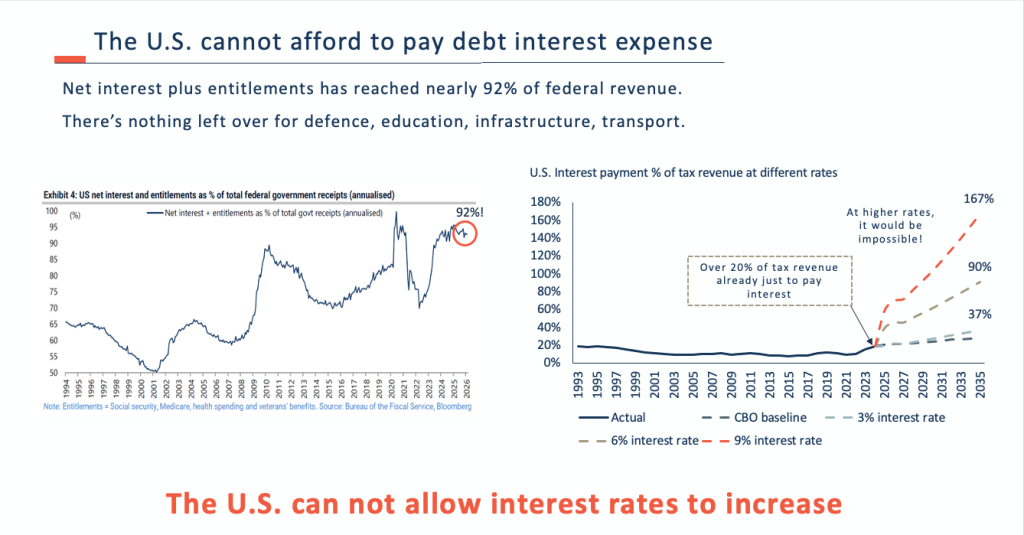
You cannot run the Volcker playbook on a $39 trillion mountain of debt. Today, even at current interest rates, nearly 92% of all tax revenue is being consumed just to pay back interest expense and mandatory outlays.
Read that again: 92%.
Source: Heyokha Research
There is almost nothing left over to run the country, let alone rebuild infrastructure or fund a global arms race. If the Federal Reserve actually hiked rates high enough to combat today’s structural inflation, they would instantly bankrupt the U.S. Treasury.
The policy flexibility of the 1970s is dead and buried. What cured inflation then would collapse the sovereign now.
The Only Exit: Financial Repression
So, if raising rates triggers a sovereign default, what does the government do?
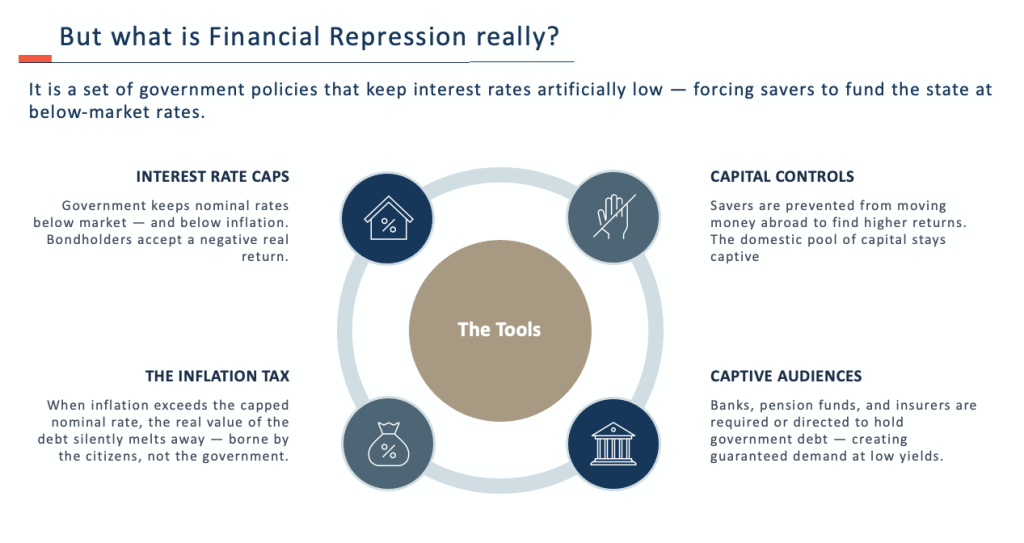
They do the only thing the math allows: Financial Repression.
They have to artificially cap nominal interest rates below the actual rate of inflation. They fire up the printers, buy their own debt, and force captive audiences (like pension funds and banks) to hold low-yielding government paper.
Source: Heyokha Research
Make no mistake—this isn’t a policy failure. It is the exact design.
By letting inflation run hotter than those capped interest rates, the real value of that $39 trillion debt silently melts away. The government pays off its historical debts with heavily devalued dollars, and regular citizens and investors foot the bill through a relentless loss of purchasing power.
The History of Shake-Outs and Liquidity Squeeze
When nominal rates are capped and inflation runs hot, real rates turn deeply negative. Returns for low-yielding bonds drops, weakening the dollar and making the case for finite gold even stronger.
Which brings us to the recent anomaly 15% drop.
That wasn’t a structural breakdown. It was a classic liquidity squeeze. We saw the exact same script play out during the 2008 Global Financial Crisis, gold plummeted nearly 30% in a matter of months. Twelve years later, during the COVID panic of March 2020, roughly had a 15% drawdown.
When equity and bond portfolios crash, highly leveraged investors are forced to liquidate their only remaining “winner”—gold—just to cover margin calls. It’s a desperate scramble for cash, not a shift in the fundamental thesis.
And what happens immediately after the forced liquidation ends? The surge.
In 2008, that drop was the springboard for a massive rally that took gold to all-time highs by 2011. In 2020, the March dump preceded a furious run-up later that same year. Every major gold bull market in history has shake-outs, which is normal and healthy.
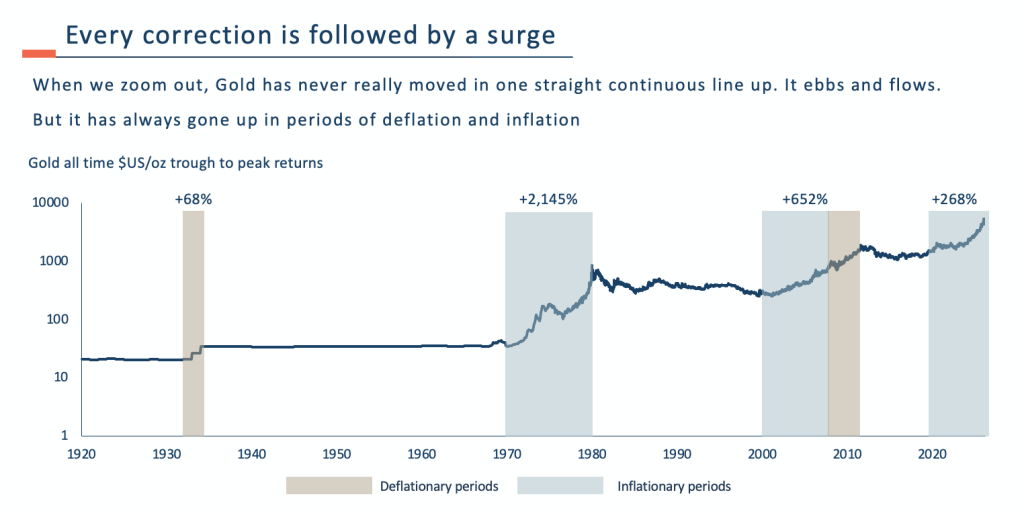
Source: Heyokha Research
Back to the 1970s, the infamous 44% correction convinced the mainstream that the gold trade was dead. They were wrong. It was the precursor to a 721% surge.
Source: Heyokha Research
The March 2026 drop is playing out exactly according to the historical script. It is the springboard for the next massive leg up.
While retail investors panic-sell the dip, the smart money is doing the exact opposite. Global central banks are aggressively accelerating their physical gold accumulation and structurally abandoning the dollar. Because global mine production has essentially plateaued, fulfilling that massive institutional demand is mathematically impossible without a significant upward revaluation in price.
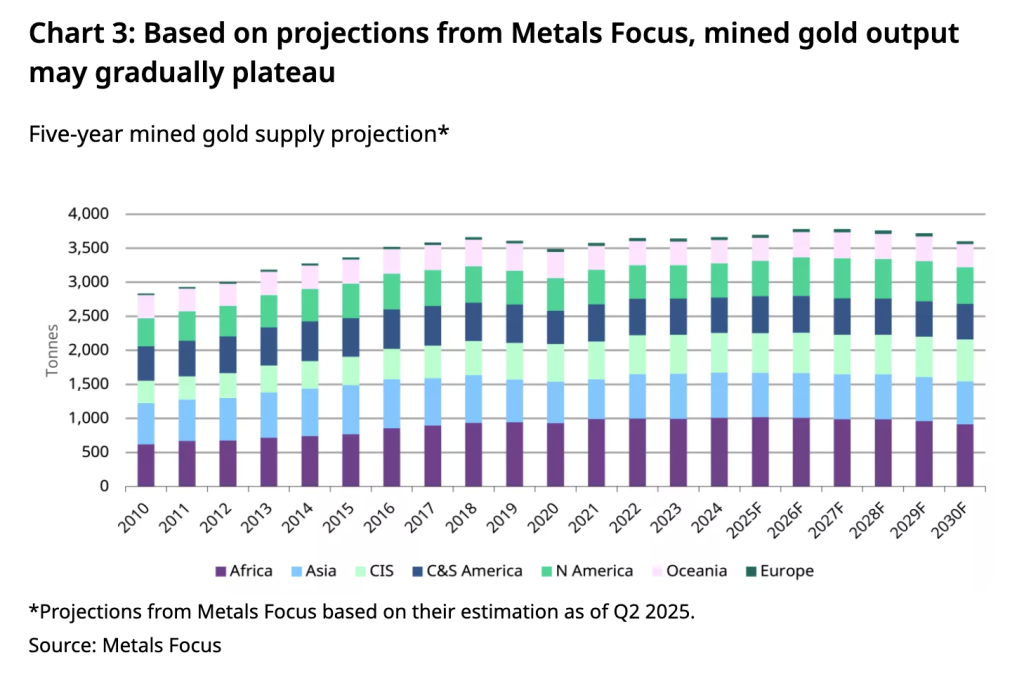
Source: Metals Focus, World Gold Council
Every major gold bull market in history has shake-outs, which is normal and healthy. That 1970s correction? It was the precursor to a 721% surge. The March 2026 drop is just the springboard for the next massive leg up.
As the fiat system breaks under the weight of its own debt, gold remains the only constant. A reversion to historical gold-to-monetary base ratios puts fair value north of $20,000 (Read more on how high gold can go up to in our Special Report – Gold the Return of Real Money)
In a world of weaponized fiat, hard assets are the ultimate financial sovereignty.
Tara Mulia
For more blogs like these, subscribe to our newsletter here!
Admin heyokha

Share


Let’s talk about the gold panic.
This past March, gold took a sharp around 15% dive in 4 weeks. Cue the mainstream commentators rushing to their history books, frantically pointing to the mid-1970s. They want you to look at the correction between December 1974 and August 1976, when gold plummeted 44% amid oil shocks and rate hikes.
The narrative they are peddling? An oil shock is happening right now too. The bull run is over. Pack it up.
It’s a great story. But it is built on a massive macro illusion. Comparing the monetary landscape of 1974 to the mathematical reality of 2026 is worse than comparing apples to oranges—it’s like comparing a paper cut to a terminal diagnosis.
If you are selling your physical assets here, you are falling for a massive liquidity trap. Let’s look at the math.
The Death of the Volcker Playbook
To understand why 1974 played out the way it did, you have to look at the sovereign balance sheet.
Back then, the U.S. debt-to-GDP ratio was sitting around 33%. The fiscal house was relatively clean. Because the government wasn’t drowning in leverage, Paul Volcker had the superpower of policy flexibility. He could hike the fed funds rate above 17% to crush inflation. It was brutal medicine, but the system could absorb it. Real rates spiked, inflation died, and gold naturally corrected.
Source: Heyokha Research
Welcome to 2026. Debt-to-GDP is 122%. The federal debt is a staggering $39 trillion.
You cannot run the Volcker playbook on a $39 trillion mountain of debt. Today, even at current interest rates, nearly 92% of all tax revenue is being consumed just to pay back interest expense and mandatory outlays.
Read that again: 92%.
Source: Heyokha Research
There is almost nothing left over to run the country, let alone rebuild infrastructure or fund a global arms race. If the Federal Reserve actually hiked rates high enough to combat today’s structural inflation, they would instantly bankrupt the U.S. Treasury.
The policy flexibility of the 1970s is dead and buried. What cured inflation then would collapse the sovereign now.
The Only Exit: Financial Repression
So, if raising rates triggers a sovereign default, what does the government do?
They do the only thing the math allows: Financial Repression.
They have to artificially cap nominal interest rates below the actual rate of inflation. They fire up the printers, buy their own debt, and force captive audiences (like pension funds and banks) to hold low-yielding government paper.
Source: Heyokha Research
Make no mistake—this isn’t a policy failure. It is the exact design.
By letting inflation run hotter than those capped interest rates, the real value of that $39 trillion debt silently melts away. The government pays off its historical debts with heavily devalued dollars, and regular citizens and investors foot the bill through a relentless loss of purchasing power.
The History of Shake-Outs and Liquidity Squeeze
When nominal rates are capped and inflation runs hot, real rates turn deeply negative. Returns for low-yielding bonds drops, weakening the dollar and making the case for finite gold even stronger.
Which brings us to the recent anomaly 15% drop.
That wasn’t a structural breakdown. It was a classic liquidity squeeze. We saw the exact same script play out during the 2008 Global Financial Crisis, gold plummeted nearly 30% in a matter of months. Twelve years later, during the COVID panic of March 2020, roughly had a 15% drawdown.
When equity and bond portfolios crash, highly leveraged investors are forced to liquidate their only remaining “winner”—gold—just to cover margin calls. It’s a desperate scramble for cash, not a shift in the fundamental thesis.
And what happens immediately after the forced liquidation ends? The surge.
In 2008, that drop was the springboard for a massive rally that took gold to all-time highs by 2011. In 2020, the March dump preceded a furious run-up later that same year. Every major gold bull market in history has shake-outs, which is normal and healthy.
Source: Heyokha Research
Back to the 1970s, the infamous 44% correction convinced the mainstream that the gold trade was dead. They were wrong. It was the precursor to a 721% surge.
Source: Heyokha Research
The March 2026 drop is playing out exactly according to the historical script. It is the springboard for the next massive leg up.
While retail investors panic-sell the dip, the smart money is doing the exact opposite. Global central banks are aggressively accelerating their physical gold accumulation and structurally abandoning the dollar. Because global mine production has essentially plateaued, fulfilling that massive institutional demand is mathematically impossible without a significant upward revaluation in price.
Source: Metals Focus, World Gold Council
Every major gold bull market in history has shake-outs, which is normal and healthy. That 1970s correction? It was the precursor to a 721% surge. The March 2026 drop is just the springboard for the next massive leg up.
As the fiat system breaks under the weight of its own debt, gold remains the only constant. A reversion to historical gold-to-monetary base ratios puts fair value north of $20,000 (Read more on how high gold can go up to in our Special Report – Gold the Return of Real Money)
In a world of weaponized fiat, hard assets are the ultimate financial sovereignty.
Tara Mulia
For more blogs like these, subscribe to our newsletter here!
Admin heyokha
Share