Shaken, Not Stirred: Turning EM Challenges into Wins
Shaken, Not Stirred: Turning EM Challenges into Wins


“Investing in EMs in the past decade is like preparing for a firework show that ends with a single sparkler—underwhelming and disappointing.”
We’re all familiar with the conversations above, albeit in different forms. Just mention “EM (Emerging Market) equity” at a cocktail party, and you’ll see people quickly finishing their drinks and changing the subject to US market investing. Could this be a classic example of Peter Lynch’s cocktail party theory, indicating that the market is bottoming out?
Beyond the liquor
In “One Up on Wall Street,” Peter Lynch identified cocktail party conversations as a significant contrarian market indicator. When people avoid discussing certain investments, it’s often a sign that the market is bottoming, presenting an opportunity to find undervalued stocks. Conversely, when such gatherings are filled with investment tips and general euphoria, it typically signals that the market is peaking and a downturn may be imminent.
The following table below showcases why people have been quickly jumping to avoid topics linked to anything with EM investing.
Discussing EM equity returns in the past decade is a conversation-stopper
Equity returns and currencies performance of EM between 2013 to Q1 2024
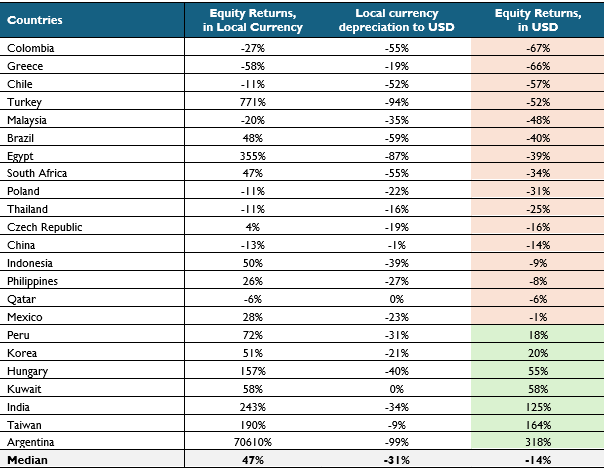
Note: The equity market return of each country is represented by its respective MSCI country index, rounded.
Source: Bloomberg
EM equity returns over the past decade have indeed been dismal, particularly in USD terms. Of the 23 emerging markets tracked by MSCI, fifteen recorded positive returns in local currency terms. However, only six recorded positive returns when local currency depreciation is taken into account.
Focusing on our Southeast Asia market, none have been positive in USD terms. It’s no wonder it feels like a rollercoaster that has never left the ground.
Take Indonesia, for instance: Indonesian equities, as represented by MSCI Indonesia, achieved a cumulative return of 50 percent over the past decade. However, when we consider the 39 percent depreciation of the Rupiah during this period, the return plunged to a negative 9 percent.
Another perspective, as illustrated in the table below, is that no less than 22 percent of Indonesian stocks are currently trading at or below IDR 50, which used to be the floor price until recent changes. This represents a record high, more than three times the figures seen during the COVID era. To make matters worse, trading volume has significantly decreased. Public expectations for future returns from equity investing are very low or nonexistent.
Penny stocks make up a fifth of Indonesian stocks
# of stocks traded at Rp 50 per share, the lowest possible price in JCI
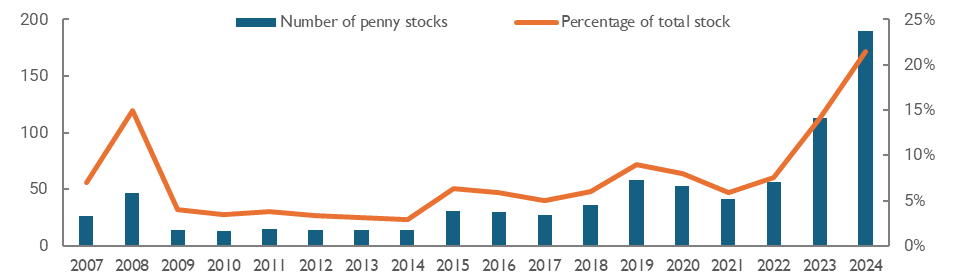
Source: Bloomberg
Moving on to the real sectors, the situation is not any better. Key economic indicators of middle-class prosperity, such as auto sales, have been going nowhere for the past 14 years since 2010, despite a 39.4% GDP per capita growth. Are things really that bad? Yes, they are.
Jakarta Composite Index (“JCI”) in USD echoes coincidence indicators
Indonesia 4W car sales, imports, and cement sales are flat
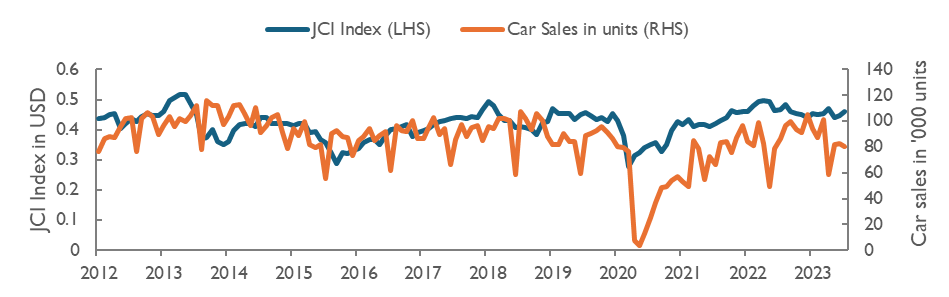
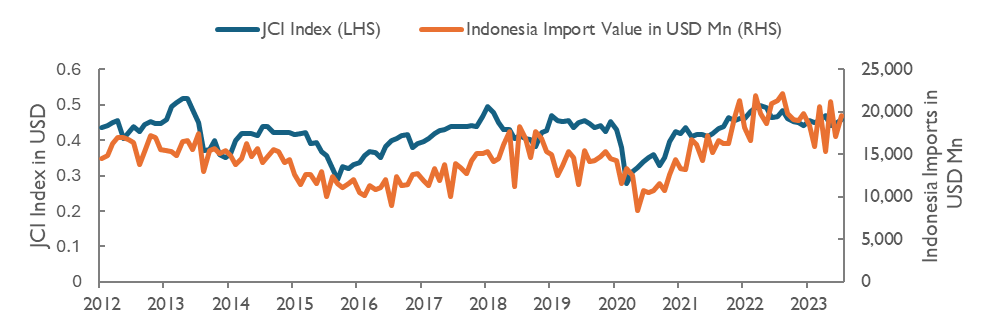
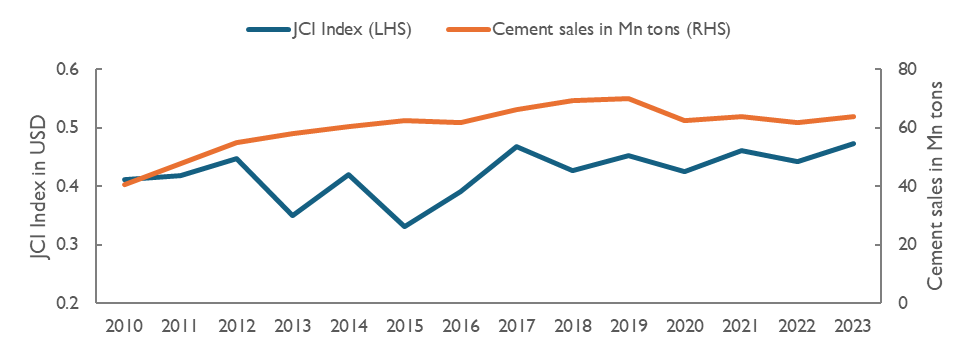
Source: Bloomberg, Gaikindo (Ministry of Industry)
Oddly enough, the number of years it takes to afford the go to car on minimum wage has decreased. What is missing here?
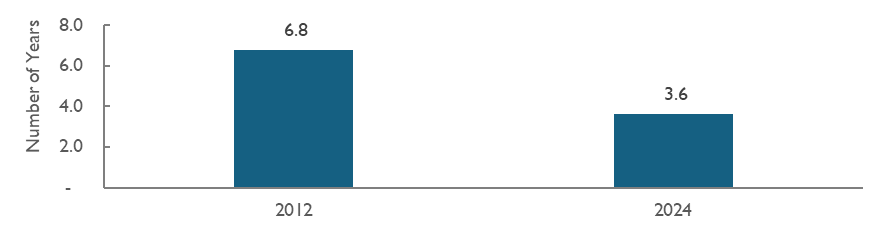
Note: Annualized average minimum wage in Indonesia divided by Toyota Avanza1.3 E M/T car price of the respective year
Source: Auto2000, Kemnaker (Ministry of Manpower).
Stockbrokers, struggling with the decreasing revenue pool, have hoped on prophecies of rate cuts. The only difference in their forecasts was which month the rate cuts were going to be delivered. We know what happened next. Until today, the coaster is still stuck on the ground and the greenback has been mighty. This has been weighing down on the EM equities.
Rate cut expectation fades?
The Fed futures rate (%) and effective fund rate
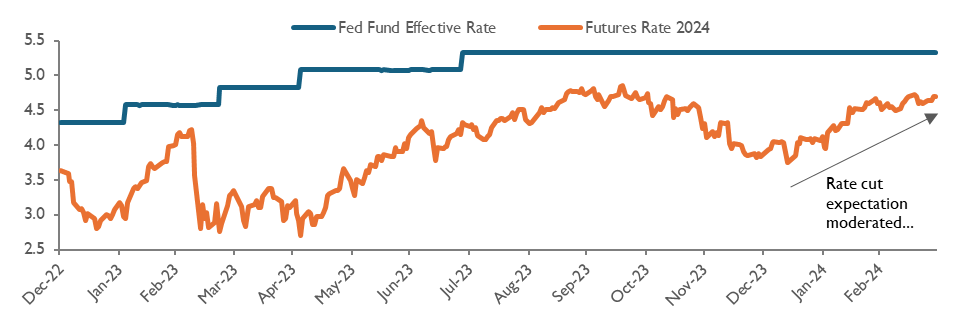
Source: Bloomberg
High interest rates draws back capital back to the US
Cumulative foreign net inflow of US portfolio (US$ Bn, since 2005) vs. Fed Fund Rate
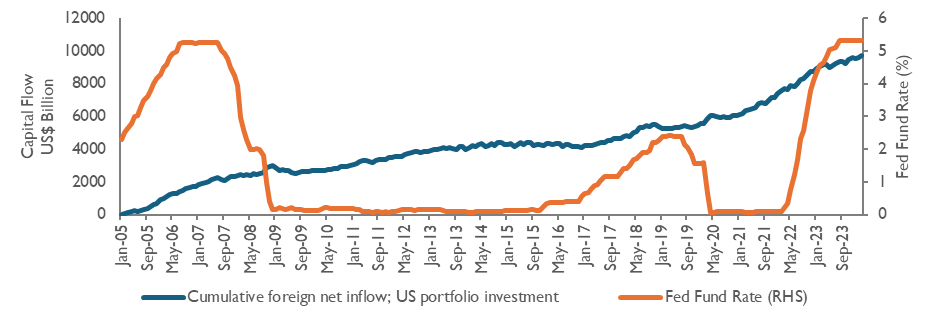
Source: Bloomberg
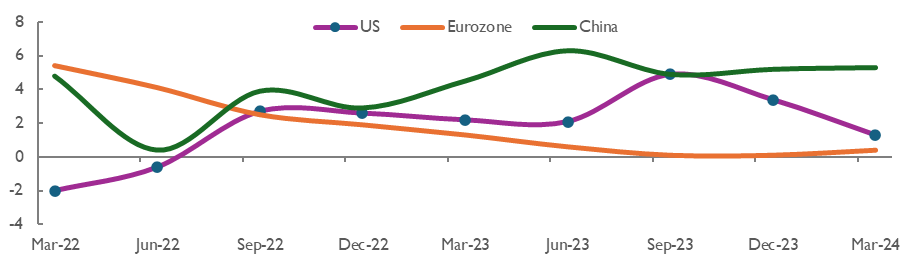
In order for EMs to start performing, the prayer list includes: (1) tamed inflation, (2) recession, and (3) rate cuts as a result of the previous two. Some of these prayers are materializing, but not yet fully granted.
Moderating inflation and weak US economics are precursors for rate cuts
Real GDP growth (YoY) stagnated in Europe, slowed in the US, and was modest in China
CPI inflation (%, YoY) moderating into a new higher-normal
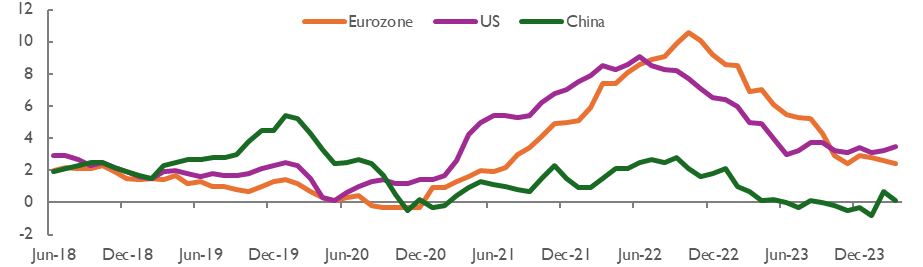
Source: Bloomberg
With all the negativity, it’s easy to fall into the gloom and doom camp about everything. However, much like a dense forest where sunlight occasionally breaks through the canopy, pockets of strength can still be found outside the US market. These bright spots offer hope and opportunity, reminding us that even amidst widespread challenges, there are areas where growth and resilience continue to thrive.
Now imagine a flat bowl balanced on a bamboo tower, filled with water. If everything were static, the water would overflow equally everywhere. But the market isn’t static; it’s a wild circus with elephants (market players) pushing the bowl, spilling water mostly where they prefer, leaving other places dry.

Some get the flow, Some do not
Similarly in emerging markets, some regions are left parched, while others are flourishing with liquidity. Take Argentina, for example. Thanks to radical changes like a smaller government and dollarization, its stock market is bubbling up nicely.
Sure, some might say Argentina’s market is just a tiny puddle in the vast ocean of global capital, with only a USD 53 billion market size. But this goes to show that even in a topsy-turvy market, there are still pockets of opportunity.
So, is it just a periphery market phenomenon in the EM space? We think not. Enter India.
Modi’s administration introduced game-changing economic reforms that transformed India into one of the world’s leading economies. In this case, the game changers are: (1) pro-investment policies and (2) savvy and effective approach to attract Western investments averting from China.
Indonesia’s trade surplus with India – potential commodity supercycle is on the horizon
India GDP (left), in bn USD. Indonesia – India trade balance (right). In USD bn
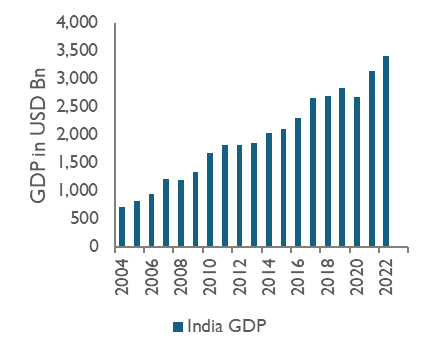
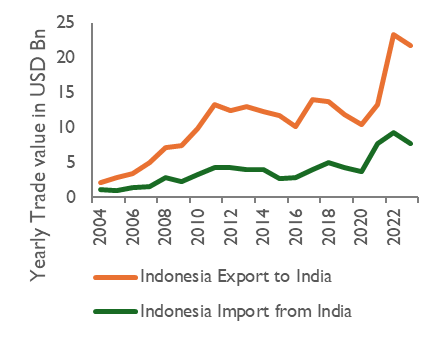
Source: Bloomberg, Government of Indonesia
Currently, India’s per capita income stands at a modest USD 2,400. However, using the rule of 72, we can make an optimistic projection. Assuming a 6% GDP per capita growth year over year, Indians will be twice as rich in just 12 years.
When incomes rise, consumption patterns change. The first things people tend to buy with their newfound wealth are goods. And when we talk about goods, we’re talking about commodities—lots of them. Increased demand for commodities translates into a thriving market for producers and exporters. Enter Indonesia, which happens to be rich in natural resources and commodities.
Indonesia stands to gain significantly from this economic evolution in India. With its vast reserves of minerals, agricultural products, and energy resources, Indonesia is perfectly positioned to supply the growing Indian appetite for commodities. As India’s middle class expands and consumption increases, Indonesian exports to India are likely to surge, benefiting both economies.
So, while India’s per capita income growth signals a brighter future for its citizens, it also opens up lucrative opportunities for Indonesia. This symbiotic relationship highlights the interconnected nature of global economies, where the prosperity of one nation can ripple out to benefit others.
Still on the subject of Indonesia, recent negative headlines have highlighted the potential for public debt to GDP to reach 50% from the current 39%. Simple arithmetic suggests that this reported figure does not add up.
Leveraging up to 50% would entail significant ramifications, including: (1) interest expenses to revenue reaching 30%, worse than Bangladesh, (2) implying a fiscal deficit of over 5%, well above the 3% limit stipulated by current law, (3) changing this law being improbable given the current parliamentary composition, (4) a significant sovereign downgrade, problematic given that the capital and current account remain negative, and (5) the crowding-out effect, where higher interest rates and an influx of government bonds discourage private sector investments.
All of the above does not seem to be a sensible move for the new Indonesian government.
Case in point: finding Pocket of performance in Indonesia
Most investors are already familiar with the success stories of Indonesia’s big four banks. However, despite the prevalent bearish sentiment in the small to mid-cap space in Indonesia, there are noteworthy fast-growing companies in this category. These companies often fly under the radar of many investors, yet they offer significant growth potential. Bisi International (BISI IJ) and Impack Pratama (IMPC IJ) are prime examples of such hidden gems. BISI IJ is a major player in agricultural solutions, providing a wide range of products and services to enhance agricultural productivity. IMPC IJ specializes in alternative building materials, offering innovative and sustainable solutions for construction projects.
What sets these companies apart is their exceptional execution in relatively niche markets that are typically unappealing to larger conglomerates. BISI IJ excels in its specialized agricultural market, leveraging its expertise to drive growth and innovation. Similarly, IMPC IJ focuses on alternative building materials, a sector often overlooked by bigger players. This focus allows both companies to carve out strong market positions and achieve impressive growth rates. Their success stories underscore the potential that exists in Indonesia’s small to mid-cap space, offering investors attractive opportunities beyond the well-known large-cap stocks.
There are gems in muddy water
CAGR (%) on TTM EPS in USD (2014-2024)
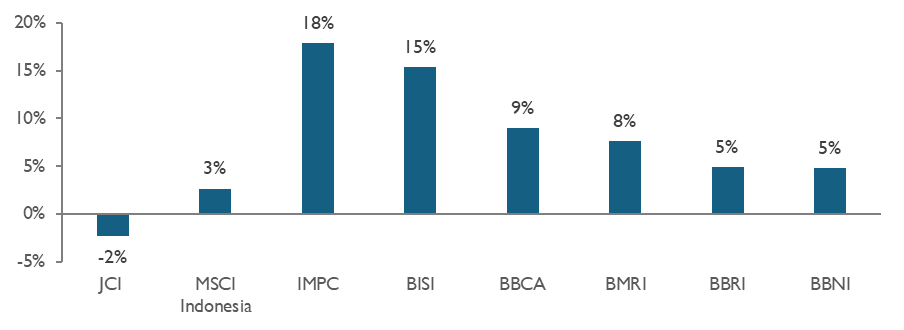
CAGR (%) on Total Net Return with Dividends in USD (2014-2024)
Source: Bloomberg
Another topic we have seen people turn away from in a cocktail party until very recently is precious metals. Gold and its poor cousin silver may seem like the dinosaurs of the investment world—static, unexciting, and about as useful as a paperweight in the digital age. It doesn’t generate dividends, won’t give you the thrill of tech stocks, and can sit there for ages without making a splash.
Here’s the kicker: investors should still keep an eye on it. Despite its old-school charm, precious metals have a knack for shining when things get rough. It’s the financial world’s version of a trusty old sweater, offering warmth and comfort when the economic weather turns chilly. So, while it might not be the flashiest asset in your portfolio, it’s definitely one asset class worth allocating into.
Time to rethink your holiday
Indonesia is breaking records, but it’s not for the hottest chili or longest dance marathon—it’s for
holidays, racking up a whopping 23 days off this year. Meanwhile, the US sticks to a lean average of 9
days. For investors, it’s been a rough ride in emerging markets, with US stocks often leaving Indonesian
ones eating dust. Interestingly in 2022, Indonesia’s Jakarta Composite Index (JCI) outshined the
S&P 500 with a dazzling 15% gain. Coincidentally, Indonesia only took 10 holidays that year, almost
mirroring the US. Could fewer holidays be the secret sauce for market success? Something to chew on
as we plan our next beach getaway!
Indonesia’s JCI outperformed S&P500 when its holidays were the lowest
Number of stock market holidays of the US vs Indonesia (in days)
Source: Bloomberg

Admin heyokha

Share


“Investing in EMs in the past decade is like preparing for a firework show that ends with a single sparkler—underwhelming and disappointing.”
We’re all familiar with the conversations above, albeit in different forms. Just mention “EM (Emerging Market) equity” at a cocktail party, and you’ll see people quickly finishing their drinks and changing the subject to US market investing. Could this be a classic example of Peter Lynch’s cocktail party theory, indicating that the market is bottoming out?
Beyond the liquor
In “One Up on Wall Street,” Peter Lynch identified cocktail party conversations as a significant contrarian market indicator. When people avoid discussing certain investments, it’s often a sign that the market is bottoming, presenting an opportunity to find undervalued stocks. Conversely, when such gatherings are filled with investment tips and general euphoria, it typically signals that the market is peaking and a downturn may be imminent.
The following table below showcases why people have been quickly jumping to avoid topics linked to anything with EM investing.
Discussing EM equity returns in the past decade is a conversation-stopper
Equity returns and currencies performance of EM between 2013 to Q1 2024
Note: The equity market return of each country is represented by its respective MSCI country index, rounded.
Source: Bloomberg
EM equity returns over the past decade have indeed been dismal, particularly in USD terms. Of the 23 emerging markets tracked by MSCI, fifteen recorded positive returns in local currency terms. However, only six recorded positive returns when local currency depreciation is taken into account.
Focusing on our Southeast Asia market, none have been positive in USD terms. It’s no wonder it feels like a rollercoaster that has never left the ground.
Take Indonesia, for instance: Indonesian equities, as represented by MSCI Indonesia, achieved a cumulative return of 50 percent over the past decade. However, when we consider the 39 percent depreciation of the Rupiah during this period, the return plunged to a negative 9 percent.
Another perspective, as illustrated in the table below, is that no less than 22 percent of Indonesian stocks are currently trading at or below IDR 50, which used to be the floor price until recent changes. This represents a record high, more than three times the figures seen during the COVID era. To make matters worse, trading volume has significantly decreased. Public expectations for future returns from equity investing are very low or nonexistent.
Penny stocks make up a fifth of Indonesian stocks
# of stocks traded at Rp 50 per share, the lowest possible price in JCI
Source: Bloomberg
Moving on to the real sectors, the situation is not any better. Key economic indicators of middle-class prosperity, such as auto sales, have been going nowhere for the past 14 years since 2010, despite a 39.4% GDP per capita growth. Are things really that bad? Yes, they are.
Jakarta Composite Index (“JCI”) in USD echoes coincidence indicators
Indonesia 4W car sales, imports, and cement sales are flat
Source: Bloomberg, Gaikindo (Ministry of Industry)
Oddly enough, the number of years it takes to afford the go to car on minimum wage has decreased. What is missing here?
Note: Annualized average minimum wage in Indonesia divided by Toyota Avanza1.3 E M/T car price of the respective year
Source: Auto2000, Kemnaker (Ministry of Manpower).
Stockbrokers, struggling with the decreasing revenue pool, have hoped on prophecies of rate cuts. The only difference in their forecasts was which month the rate cuts were going to be delivered. We know what happened next. Until today, the coaster is still stuck on the ground and the greenback has been mighty. This has been weighing down on the EM equities.
Rate cut expectation fades?
The Fed futures rate (%) and effective fund rate
Source: Bloomberg
High interest rates draws back capital back to the US
Cumulative foreign net inflow of US portfolio (US$ Bn, since 2005) vs. Fed Fund Rate
Source: Bloomberg
In order for EMs to start performing, the prayer list includes: (1) tamed inflation, (2) recession, and (3) rate cuts as a result of the previous two. Some of these prayers are materializing, but not yet fully granted.
Moderating inflation and weak US economics are precursors for rate cuts
Real GDP growth (YoY) stagnated in Europe, slowed in the US, and was modest in China
CPI inflation (%, YoY) moderating into a new higher-normal
Source: Bloomberg
With all the negativity, it’s easy to fall into the gloom and doom camp about everything. However, much like a dense forest where sunlight occasionally breaks through the canopy, pockets of strength can still be found outside the US market. These bright spots offer hope and opportunity, reminding us that even amidst widespread challenges, there are areas where growth and resilience continue to thrive.
Now imagine a flat bowl balanced on a bamboo tower, filled with water. If everything were static, the water would overflow equally everywhere. But the market isn’t static; it’s a wild circus with elephants (market players) pushing the bowl, spilling water mostly where they prefer, leaving other places dry.
Some get the flow, Some do not
Similarly in emerging markets, some regions are left parched, while others are flourishing with liquidity. Take Argentina, for example. Thanks to radical changes like a smaller government and dollarization, its stock market is bubbling up nicely.
Sure, some might say Argentina’s market is just a tiny puddle in the vast ocean of global capital, with only a USD 53 billion market size. But this goes to show that even in a topsy-turvy market, there are still pockets of opportunity.
So, is it just a periphery market phenomenon in the EM space? We think not. Enter India.
Modi’s administration introduced game-changing economic reforms that transformed India into one of the world’s leading economies. In this case, the game changers are: (1) pro-investment policies and (2) savvy and effective approach to attract Western investments averting from China.
Indonesia’s trade surplus with India – potential commodity supercycle is on the horizon
India GDP (left), in bn USD. Indonesia – India trade balance (right). In USD bn
Source: Bloomberg, Government of Indonesia
Currently, India’s per capita income stands at a modest USD 2,400. However, using the rule of 72, we can make an optimistic projection. Assuming a 6% GDP per capita growth year over year, Indians will be twice as rich in just 12 years.
When incomes rise, consumption patterns change. The first things people tend to buy with their newfound wealth are goods. And when we talk about goods, we’re talking about commodities—lots of them. Increased demand for commodities translates into a thriving market for producers and exporters. Enter Indonesia, which happens to be rich in natural resources and commodities.
Indonesia stands to gain significantly from this economic evolution in India. With its vast reserves of minerals, agricultural products, and energy resources, Indonesia is perfectly positioned to supply the growing Indian appetite for commodities. As India’s middle class expands and consumption increases, Indonesian exports to India are likely to surge, benefiting both economies.
So, while India’s per capita income growth signals a brighter future for its citizens, it also opens up lucrative opportunities for Indonesia. This symbiotic relationship highlights the interconnected nature of global economies, where the prosperity of one nation can ripple out to benefit others.
Still on the subject of Indonesia, recent negative headlines have highlighted the potential for public debt to GDP to reach 50% from the current 39%. Simple arithmetic suggests that this reported figure does not add up.
Leveraging up to 50% would entail significant ramifications, including: (1) interest expenses to revenue reaching 30%, worse than Bangladesh, (2) implying a fiscal deficit of over 5%, well above the 3% limit stipulated by current law, (3) changing this law being improbable given the current parliamentary composition, (4) a significant sovereign downgrade, problematic given that the capital and current account remain negative, and (5) the crowding-out effect, where higher interest rates and an influx of government bonds discourage private sector investments.
All of the above does not seem to be a sensible move for the new Indonesian government.
Case in point: finding Pocket of performance in Indonesia
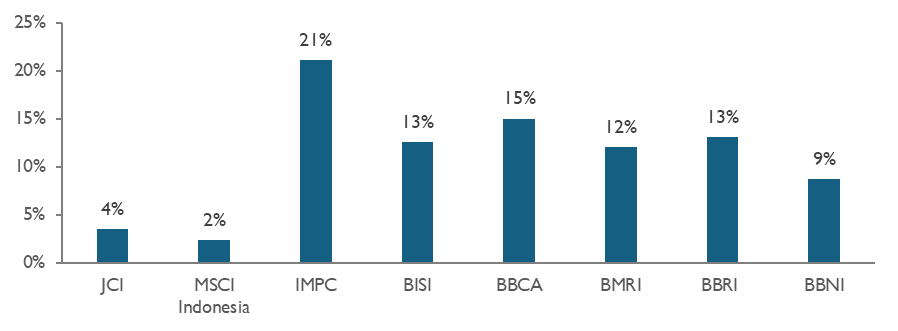
Most investors are already familiar with the success stories of Indonesia’s big four banks. However, despite the prevalent bearish sentiment in the small to mid-cap space in Indonesia, there are noteworthy fast-growing companies in this category. These companies often fly under the radar of many investors, yet they offer significant growth potential. Bisi International (BISI IJ) and Impack Pratama (IMPC IJ) are prime examples of such hidden gems. BISI IJ is a major player in agricultural solutions, providing a wide range of products and services to enhance agricultural productivity. IMPC IJ specializes in alternative building materials, offering innovative and sustainable solutions for construction projects.
What sets these companies apart is their exceptional execution in relatively niche markets that are typically unappealing to larger conglomerates. BISI IJ excels in its specialized agricultural market, leveraging its expertise to drive growth and innovation. Similarly, IMPC IJ focuses on alternative building materials, a sector often overlooked by bigger players. This focus allows both companies to carve out strong market positions and achieve impressive growth rates. Their success stories underscore the potential that exists in Indonesia’s small to mid-cap space, offering investors attractive opportunities beyond the well-known large-cap stocks.
There are gems in muddy water
CAGR (%) on TTM EPS in USD (2014-2024)
CAGR (%) on Total Net Return with Dividends in USD (2014-2024)
Source: Bloomberg
Another topic we have seen people turn away from in a cocktail party until very recently is precious metals. Gold and its poor cousin silver may seem like the dinosaurs of the investment world—static, unexciting, and about as useful as a paperweight in the digital age. It doesn’t generate dividends, won’t give you the thrill of tech stocks, and can sit there for ages without making a splash.
Here’s the kicker: investors should still keep an eye on it. Despite its old-school charm, precious metals have a knack for shining when things get rough. It’s the financial world’s version of a trusty old sweater, offering warmth and comfort when the economic weather turns chilly. So, while it might not be the flashiest asset in your portfolio, it’s definitely one asset class worth allocating into.
Time to rethink your holiday
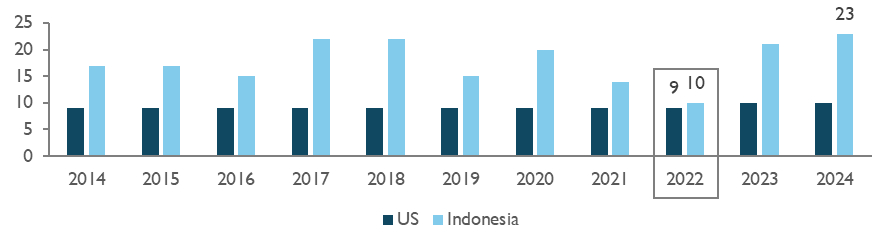
Indonesia is breaking records, but it’s not for the hottest chili or longest dance marathon—it’s for
holidays, racking up a whopping 23 days off this year. Meanwhile, the US sticks to a lean average of 9
days. For investors, it’s been a rough ride in emerging markets, with US stocks often leaving Indonesian
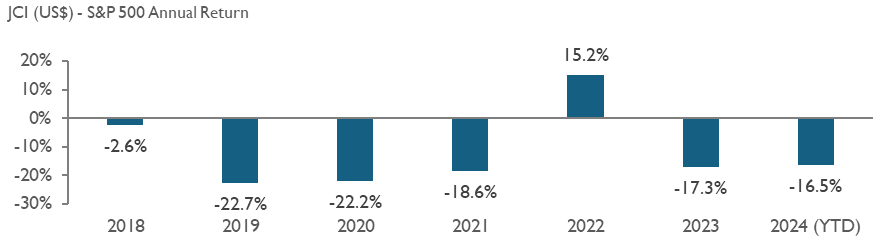
ones eating dust. Interestingly in 2022, Indonesia’s Jakarta Composite Index (JCI) outshined the
S&P 500 with a dazzling 15% gain. Coincidentally, Indonesia only took 10 holidays that year, almost
mirroring the US. Could fewer holidays be the secret sauce for market success? Something to chew on
as we plan our next beach getaway!
Indonesia’s JCI outperformed S&P500 when its holidays were the lowest
Number of stock market holidays of the US vs Indonesia (in days)
Source: Bloomberg
Admin heyokha
Share